Air traffic in Latin America and the Caribbean (LAC) grew 4.3% year-on-year in August
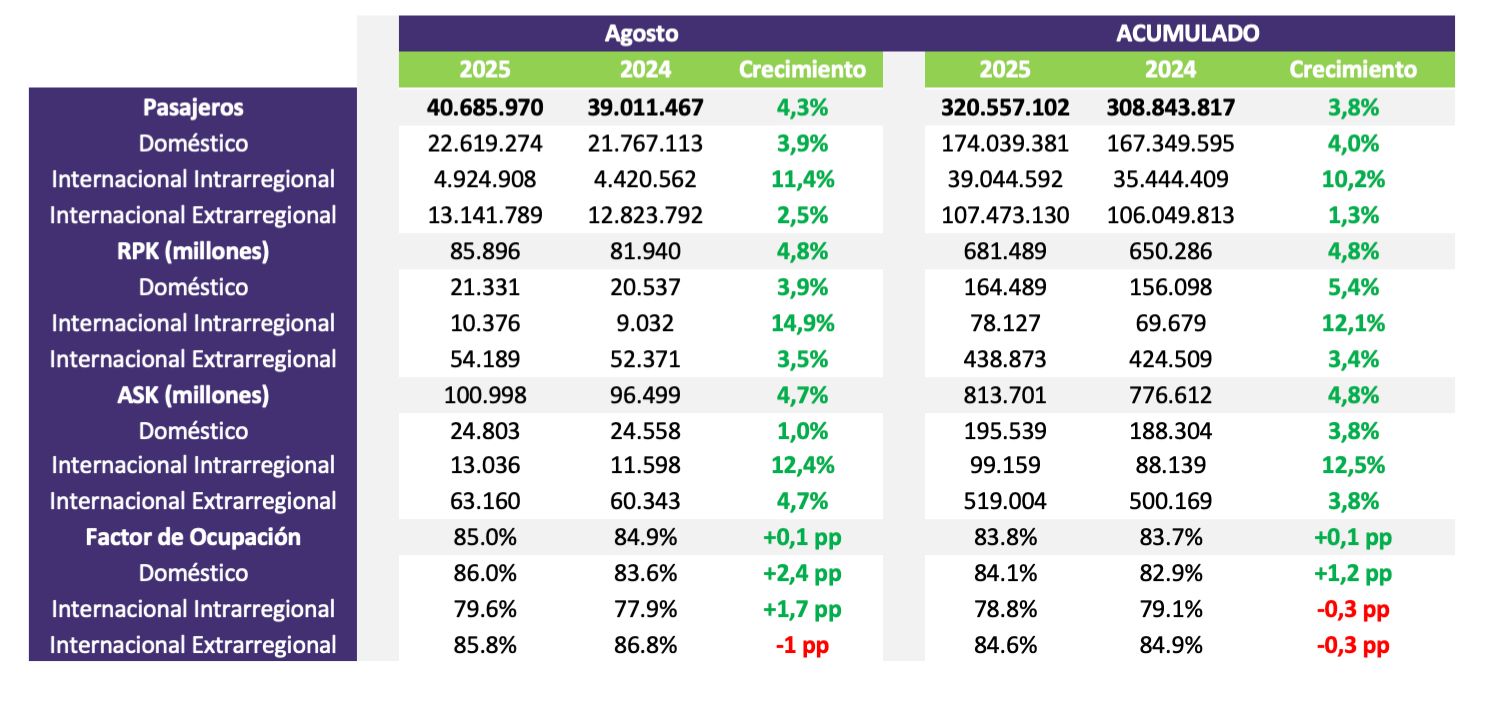
In August 2025, total passenger traffic to, from, and within Latin America and the Caribbean reached 40.7 million passengers
October 20, 2025

In August 2025, total passenger traffic to, from, and within Latin America and the Caribbean reached 40.7 million passengers, an increase of 4.3% compared to August 2024 (equivalent to an additional 1.7 million passengers). Intra-regional traffic accounted for 81% of the net increase, driven mainly by the domestic markets of Brazil, Argentina, and Peru, which contributed more than half of the growth.
Flight supply grew by 1.2% year-on-year, while total capacity (seats) increased by 2.5%, reflecting the use of larger aircraft, with an average of 160 seats per flight compared to 158 in August 2024[1] .
Summary of indicators
- Capacity measured in available seat kilometers (ASK) grew 4.7% year-on-year.
- Demand, measured in revenue passenger kilometers (RPK), increased 4.8% year-on-year.
- The average load factor was 85%.
- In the January-August period, air traffic in LAC reached 320.6 million passengers, representing growth of 3.8% compared to the same period in 2024.
Brazil and Argentina led passenger growth
Brazil was the market that contributed most to regional growth in August, with 973,000 additional passengers (+9.5% year-on-year). The domestic market reached a historic record for August (8.7 million passengers, +8.6%), making it the fastest-growing domestic market among the six largest in the world, according to IATA[2] . The international segment grew 13.1% year-on-year, supported by a 38% increase in foreign tourist arrivals[3] .
Argentina also showed solid performance, with +14.4% year-on-year (domestic +10.6%, international +19.1%). It was the busiest August in history, exceeding the August 2019 level by 6%. Between January and August, the country accumulated 21.8 million passengers (+14.7%).
Mexico, Colombia, and Chile recorded growth below the regional average
Mexico, Colombia, and Chile, which rank 2nd, 3rd, and 6th in the region in terms of passenger volume, respectively, recorded combined growth of just 0.7% year-on-year, well below the regional average.
In Mexico, total traffic reached 10.2 million passengers (+1.3% year-on-year), with similar increases in the domestic (+1.3%) and international (+1.2%) segments. Traffic with the United States, the third largest country pair in the region, grew for the second consecutive month (+0.3% in August) after the decline in June, remaining virtually stable in the January–August period (-0.05% year-on-year).
Colombia showed a slight contraction (-0.1% year-on-year), with 5.06 million passengers. The domestic market fell 3.2%, while the international market increased 4.1%, with significant increases in traffic with Ecuador (+14%), Brazil (+26%), and Peru (+11%). In the January-August period, the domestic market fell by 1.9% compared to 2024, affected by the decline in Bogotá (-4.9%).
In August 2025, Chile had its first negative result of the year in total passengers (-0.2% year-on-year). Domestic traffic, which represents 53% of the total, fell 2.2%, while international traffic increased 2.2% year-on-year. Traffic on secondary domestic routes (not originating in or terminating in Santiago) grew 3.7% year-on-year, with the Antofagasta–Concepción (+33% year-on-year) and Antofagasta–La Serena (+8% year-on-year) routes standing out.
"The August data confirms solid growth and a clear trend: connectivity between Latin American countries is now the main driver of air traffic growth. Behind every point of growth there are thousands of stories: families reuniting, businesses expanding, and communities integrating," said Peter Cerdá, CEO of ALTA.
Peru and Ecuador maintain positive performance
Peru carried 2.6 million passengers (+6.5% year-on-year), with growth in both the domestic (+5.1%) and international (+8.6%) markets, driven by routes to Colombia (+11%), Brazil (+19%), and the Dominican Republic (+28%). Ecuador transported 835,000 passengers (+4.2% year-on-year), with strong growth in traffic with Colombia (+14%). Total flight capacity in Ecuador grew 6.1% year-on-year, with significant increases on routes to Argentina (+94%) and th[4] .
Panama and the Dominican Republic drive growth in Central America and the Caribbean
In Central America, traffic to and from the subregion grew by 7.0% year-on-year, led by Panama (+11.5%, 1.85 million passengers). It was followed by Costa Rica (+2.2%), El Salvador (+0.3%) and Guatemala (+2.4%).
In the Caribbean, total traffic increased by 5.3%, with the Dominican Republic leading the way (+6.0%, 1.7 million passengers). Jamaica grew by 3.6%, while Cuba declined by 6.2%. The Caribbean–United States market carried 2.9 million passengers in August (+0.6% year-on-year) and accumulated 22.4 million in January–August 2025 (–1.1% compared to the same period in 2024)[5] .
Glossary: RPK (Revenue Passenger Kilometers) number of paying passengers transported multiplied by the distance traveled | ASK (Available Seat Kilometers) number of seats available for sale multiplied by the distance traveled | Load Factor. Obtained by dividing RPK by ASK.
Methodological Note
In this document, the Latin America and Caribbean (LAC) region is defined as the sum of South America, Central America, the Caribbean, and Mexico. This definition is used consistently for all regional and international traffic analyses.
Domestic flights are those within a single country. International traffic is classified into two main segments:
Intraregional international traffic: flights between countries within LAC (e.g., Argentina–Brazil or Mexico–Colombia).
Extra-regional international traffic: flights between LAC and other regions of the world (such as North America, Europe, Asia-Pacific, the Middle East, or Africa).
[1] ALTA internal calculations based on Cirium SRS Schedules Analyzer data (consulted: September 2025)
[2] IATA, Air Passenger Market Analysis – August 2025, IATA Sustainability & Economics
[3] Embratur, Data Panels – International Arrivals, accessed September 26, 2025, available at: https://embratur.com.br/para-o-trader/inteligencia-de-dados/paineis-de-dados/chegadas-internacionais/
[4] ALTA internal calculations based on data from Cirium SRS Schedules Analyzer (accessed September 2025)
[5] U.S. Department of Commerce, International Trade Administration. I-92 International Air Passenger Statistics Dashboard. Accessed September 25, 2025. Available at: https://www.trade.gov/data-visualization/i92-dashboard-beta


